Visualizing the community of engineering studies scholars
I generated a co-citation network for the journal, Engineering Studies. Co-citation is defined as the frequency with which two documents are cited together by other documents. To explore the graph, download this pdf, or if you have Gephi, click here.

What I did this time:
- Using Web of Science, I downloaded all 173 articles published in Engineering Studies from its inception in 2009 until 30 November 2021.
- Created a co-citation network using Sci2tool and this tutorial(archived version) by Scott Weingart.
- In Sci2tool, I removed any edge between articles unless they’ve been cited together more than once.
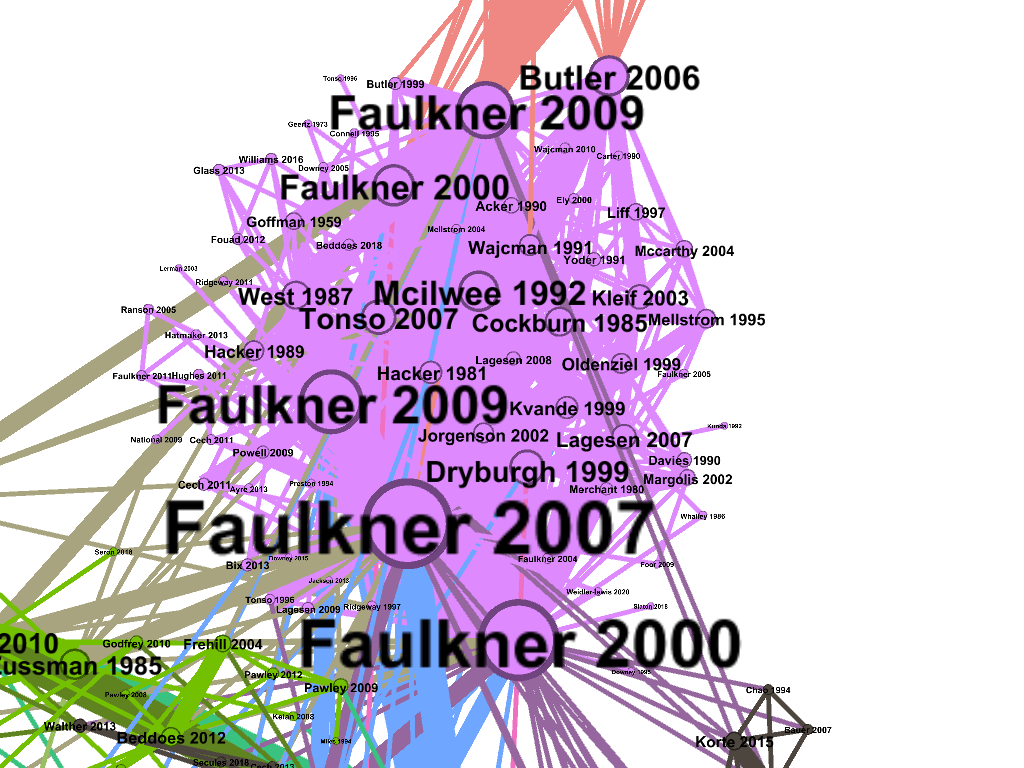
- In Sci2tool, I removed any remaining isolated components and the small islands, focusing instead on the “blob,” the single strongly connected component shown here.
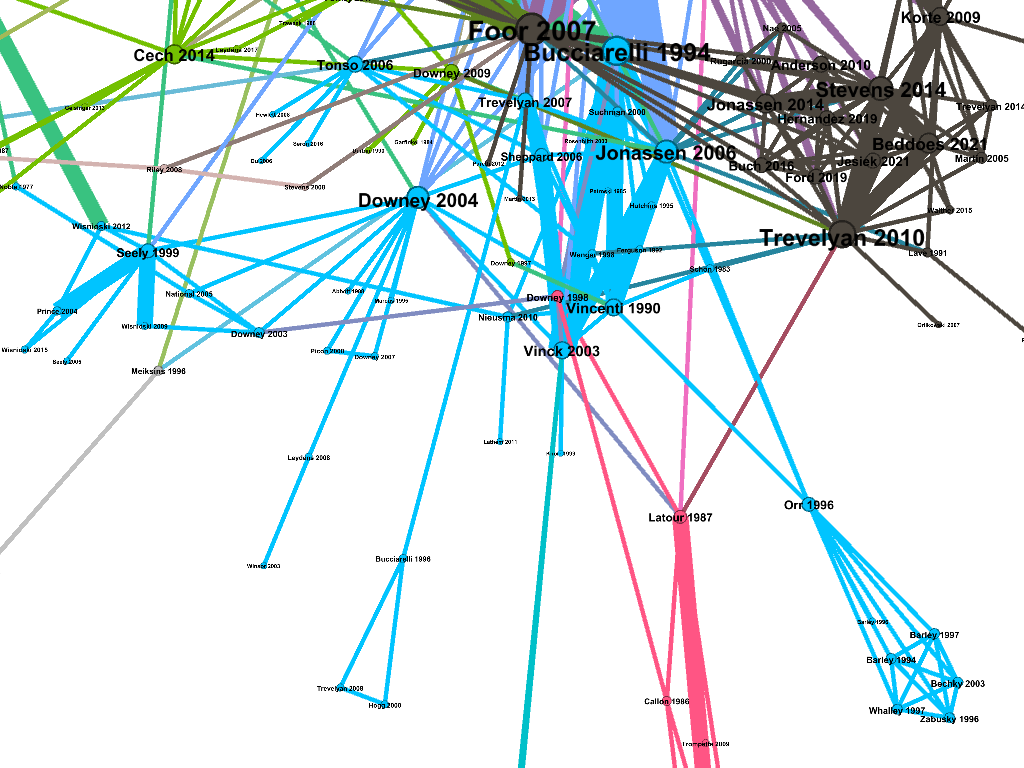
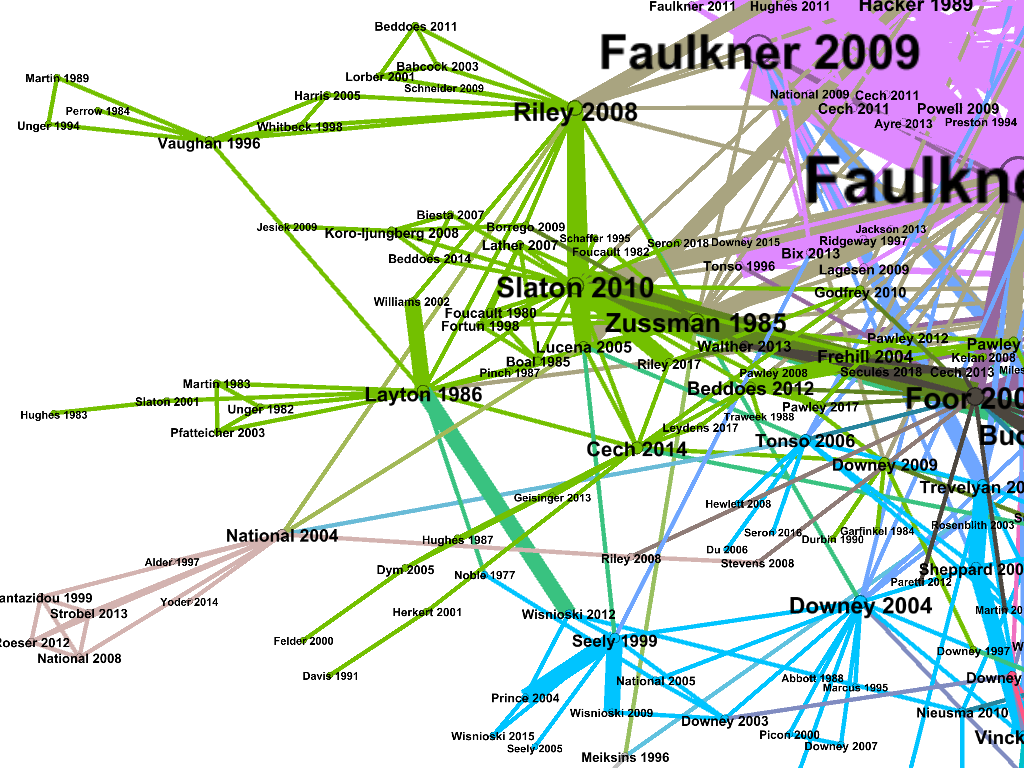
- In Gephi, I clarified the visualization using these suggestions. For instance, I color-coated based on modularity class (clusters of articles that tended to be cited together more often than others).
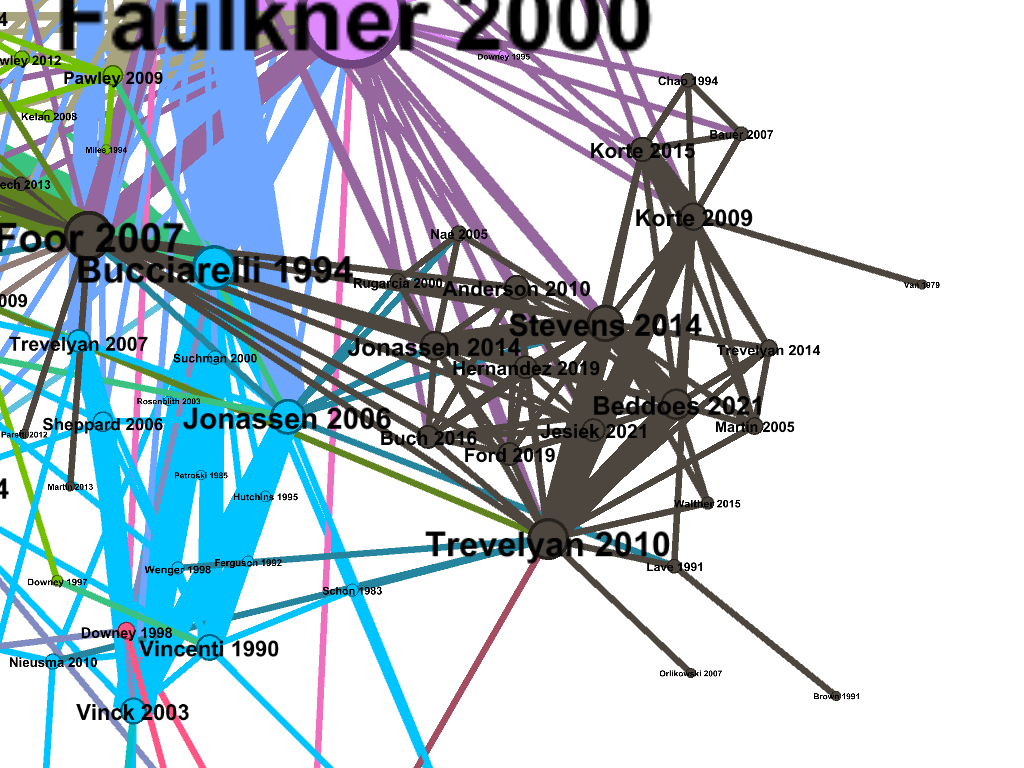
There were a few modularity classes. The largest, in purple, was greatly influenced by the work of Wendy Faulkner.
Next largest were in blue, green, orange, and gray.
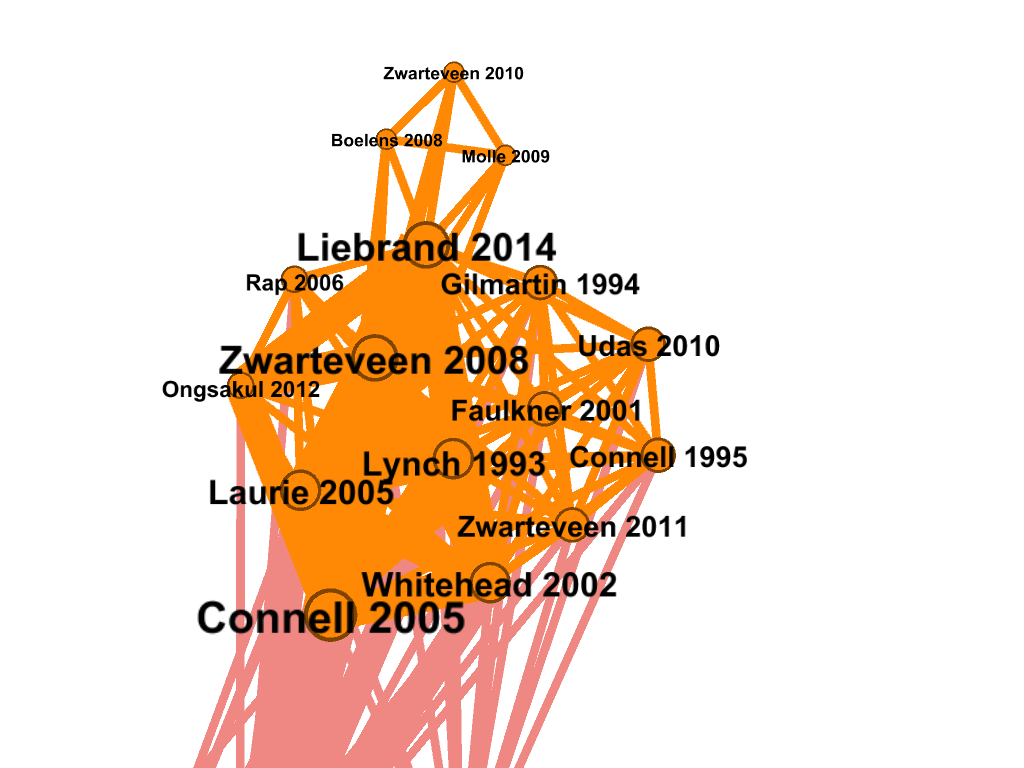
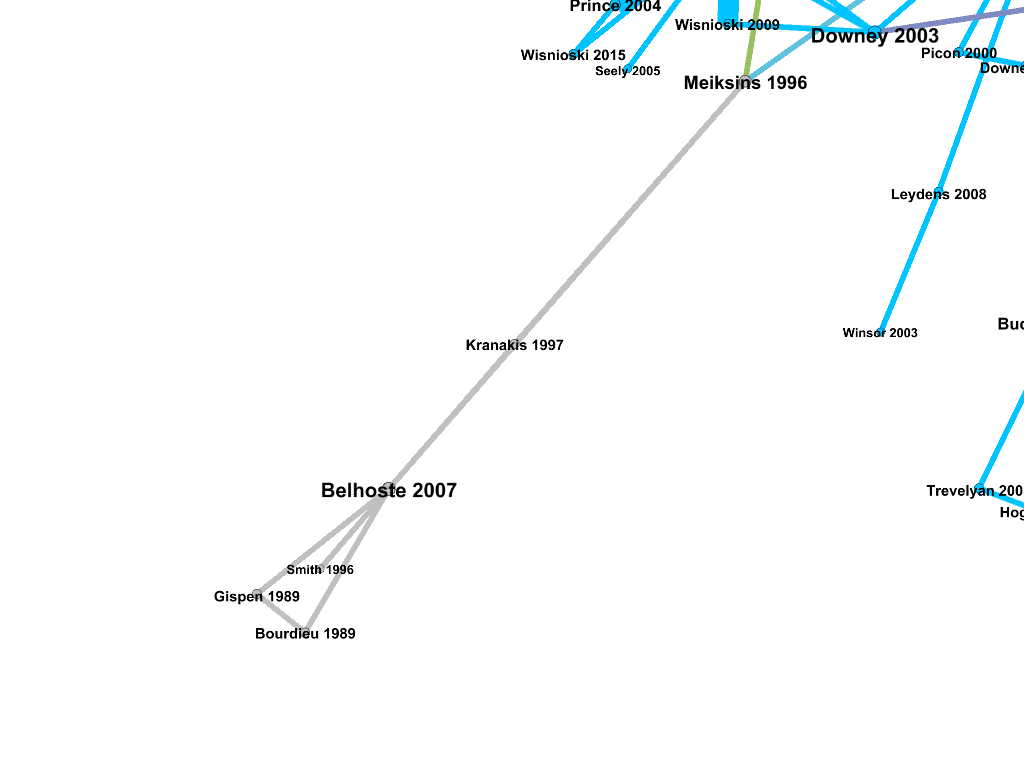
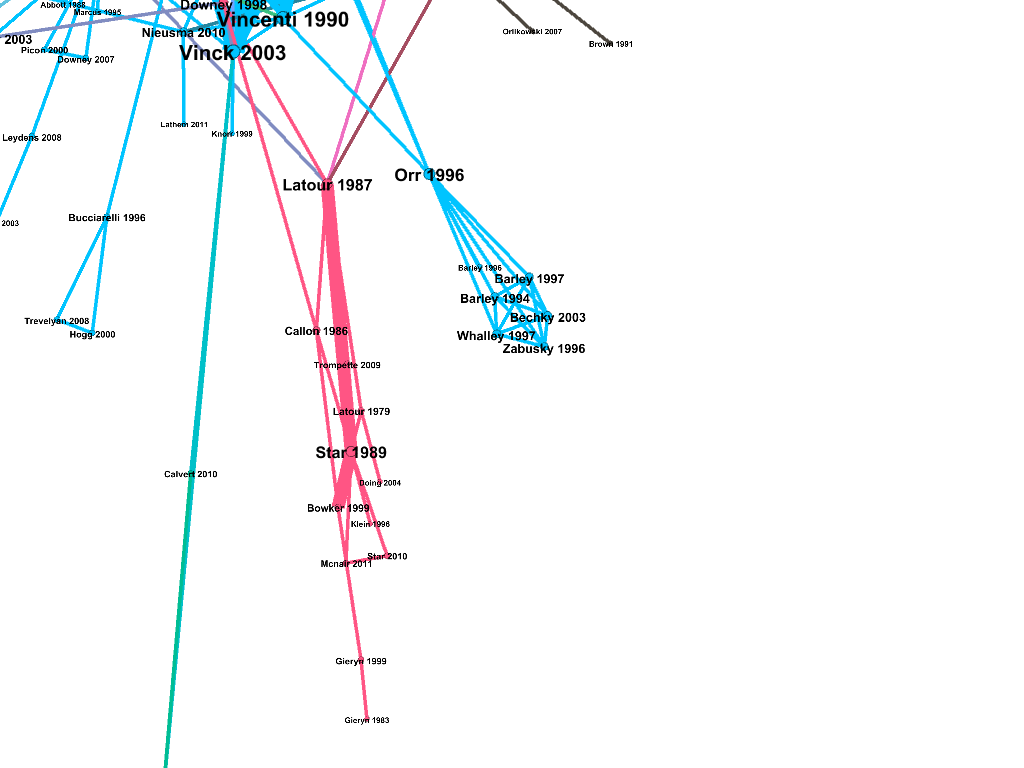
Two smaller ones worth noting are in light gray and pink.
Written on November 30, 2021